South launch
LocateRamp 1
- Upper approach
- Waiting for a fresh reading
- Can I launch?
- Call before towing
Upper approachDown toward the lake
Mapped groundWater unavailable
Access report & sources
A reviewed ramp notice has not been saved yet.
Official USGS measurements
6-hour average
Waiting for enough readings
Official forecast unavailable
Checking upstream weather…A complete, fresh precipitation forecast is needed.
Seasonal lake levelsSeasonal record unavailable
The Corps’ reservoir model accounts for current water level, observed and forecast inflow, precipitation, seasonal operating targets, downstream river conditions and planned releases. Its forecast reaches this page through NOAA.
Seasonal comparisons describe the middle 80% of approved USGS daily lake levels from October 2012 through December 2025, within seven calendar days of today. They describe past conditions, not future levels.
The 2026 water-control manual describes rainfall, snowmelt, soil moisture, runoff and dam operations as inputs to the forecasting process. The season and downstream water needs matter as much as the weather at the marina.
Corps forecasting method · chapter 6Long views use the same USGS gauge, summarized one day at a time.
Loading annual comparisons…
The 7-, 20- and 30-day views use individual USGS readings. The 90- and 365-day views use daily averages calculated here from that same gauge; these are not USGS-published daily statistics. A day needs at least 77 of its 96 quarter-hour slots (80% coverage). Days run midnight to midnight UTC; the current unfinished day is excluded. Missing days leave gaps.
Highs and lows use the original recorded readings, so they can extend beyond the daily-average line. All statistics describe available observations; missing readings could hide a higher or lower level. The archive is checked when this section comes into view and reused for up to 6 hours. The current lake reading above still checks every 5 minutes. USGS provisional values can be revised. “Close to summer pool” describes elevation, not safe boat access. The annual comparison describes the past; it is not a prediction.
USGS Tygart Lake gauge & recordSummer pool is 1,093.5 feet NAVD88. The Corps’ 2026 manual gives this conservation reference and an operating band of 1,093.5–1,095.5 ft. Seasonal drawdown can bring the lake toward the 1,039.5 ft winter reference. Below summer pool does not necessarily mean unusually low for the season.
USGS station 03055500 supplies the measured elevation. Provisional measurements can be revised. This page checks for lake updates every 5 minutes while visible, when opened and when you return. Weather is checked every 15 minutes; Refresh checks both. “Measured” is the gauge observation time; “Checked” is the last successful source retrieval, including any server cache (up to 5 minutes). USGS commonly records every 15 minutes and transmits about hourly; this is the latest available measurement, not a continuous live sensor stream. Two-hour-old lake readings pause the ramp estimates and seasonal comparison. Red numbers mark a difference of more than five feet from summer pool; this color is not a flood warning or a launch-safety rating.
The main forecast is supplied by the Corps through NOAA, with its issue time shown. Points between forecast hours are interpolated; no present-day pace is extended into the future. Forecasts more than 48 hours old or inconsistent with the gauge are withheld.
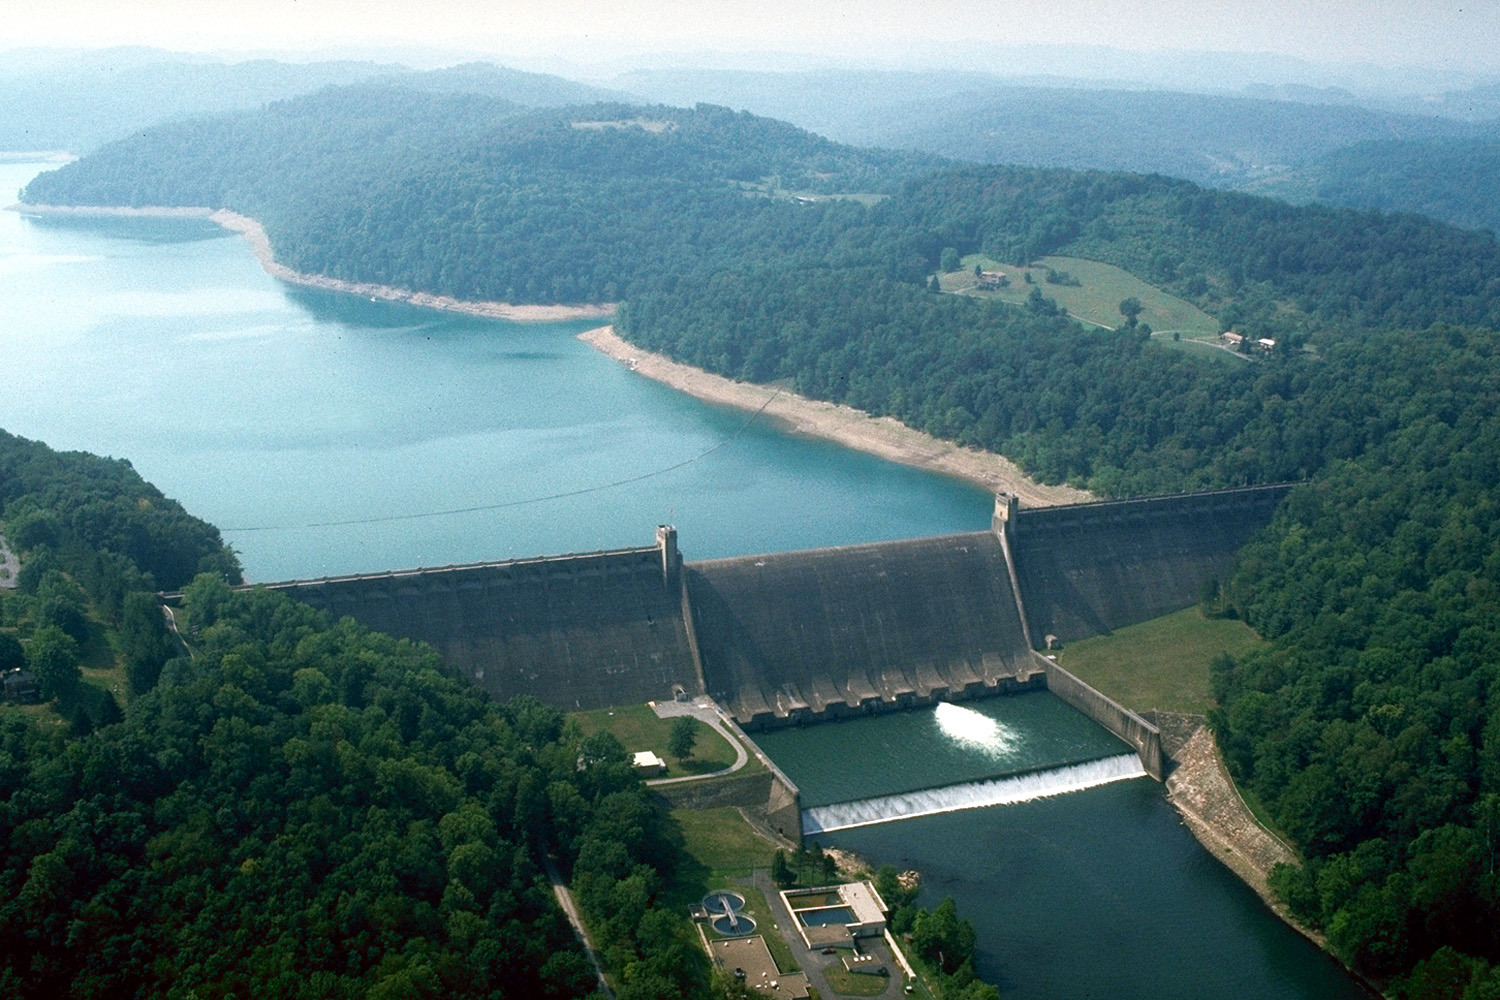
Header photograph: Margaret Luzier / U.S. Army Corps of Engineers, public domain. Archival view of Tygart Lake, not a live camera. This is an independent conditions guide, unaffiliated with USGS, NOAA, the Corps, WV State Parks or the marina. Use operator notices and on-site conditions for access decisions.
Weather data: Open-Meteo, CC BY 4.0. We convert units, average four upstream locations; these are our calculations. USGS observations and NOAA/NWS forecast data are public-domain federal information.
A reviewed ramp notice has not been saved yet.
A reviewed ramp notice has not been saved yet.
The blue line shows the lake level; the brown line follows mapped ground. The shaded band marks the estimated elevation of the ramp top.
Locations come from WVDNR. Ground elevations use one-meter USGS 3DEP data, in the same NAVD88 reference as the lake gauge, from a lidar project collected in 2018–2020. The preliminary upper-ramp bands are 1,110–1,119 ft for Ramp 1 and 1,107–1,116 ft for Ramp 2.
The ranges include a two-foot allowance on each side for uncertainty. Check current launch access with the park.